December Rental Report: Despite Rent Growth, Renting A Starter Home Is More Affordable Than Buying
December Rental Report: Despite Rent Growth, Renting A Starter Home Is More Affordable Than Buying
Do you like this Article ?
Sign up HERE for your FREE M&M Account to receive more Real Estate related information and news and THIS article.
M&M Membership includes: FREE Coaching Events & Workshops, access to our Real Estate News Group (Local & National Real Estate and Financial News), access to social media marketing tips and nuggets, So Cal weekly market report, and much more.

December Rental Report: Despite Rent Growth, Renting A Starter Home Is More Affordable Than Buying
Highlights
- With the year-over-year growth rate slowing to 3.2% in December, the 2022 average growth rate for 0-2 bedroom properties across the top 50 metros finished the year in double-digits, at 11.6%.
- Signaling a potential reversal of the recent slowdown, median asking rent plateaued in December ($1,712), tying November’s level which was down by $69 from July’s peak.
- In 45 of the 50 largest U.S. metros, the monthly cost of renting a home is lower than buying a starter home, and despite higher rents, renting has become relatively more affordable than buying year-over-year.
- Looking ahead, strong rental demand is expected to outpace improvements in rental supply. Realtor.com® forecasts that rent growth will continue in 2023, at roughly half the pace of 2022 (6.3%), narrowly above the 2013 to 2019 average rent growth.
After an entire year of slowing down, the year-over-year median rent growth for 0-2 bedroom properties across the top 50 metros hit 3.2% in December 2022, the lowest growth rate in 20 months, down notably from January’s peak trend (17.4%). However, after four months of declines, median asking rent plateaued in December ($1,712). It is down by $69 from the peak (July 2022) and is still $308 (21.9%) higher than December 2019 (pre-pandemic).

The advantage of renting is growing in rent-favoring markets
A common question potential first-time homebuyers face is whether it makes sense to continue renting or make a home purchase. One of the top considerations is the financial costs and benefits of renting versus owning, and one approach is to compare the monthly housing costs of renting a home against the costs of buying a home. To determine the monthly cost of buying a home, we find the median listing price of 0-2 bedrooms home listings (i.e., starter homes). As first time home buyers plan lower down payments, we assume a 7% down payment (based on the national average since 2018) and use the 30-year fixed mortgage rate during the month to calculate a monthly mortgage payment. We also include the HOA fees, taxes, and homeowner’s insurance averaged at metro levels as part of the costs. We then compare this buy-cost to the median rent in each metro and focus on the difference between monthly expenses for each.
In December 2022, a typical renter from the top 50 metros faced $792 (41.4%) lower monthly payment than a starter homeowner on average. In addition, renting is the more affordable option than buying a starter home in 45 of the 50 largest metros. This is a huge increase compared to 12 months ago when renting was the more affordable option in 30 metros.
The monthly savings from renting in rent-favoring markets grew compared to the prior year. In these markets, the monthly cost of buying a starter home in December 2022 was $906 (48.0%) higher than the cost of renting, on average. However, renting a 0-2 bedroom unit in the rent-favoring markets in Dec. 2021 would have saved just $450 (22.9%), on average.
Slowing rent growth contributed to this shift: in December 2022, the year-over-year growth in rent-favoring markets was only 3.4%, one fifth of the pace observed 12 months ago. At the same time, skyrocketing mortgage rates upped the cost of taking on a mortgage, making renting relatively more affordable compared to buying. In December 2022, with an average 30-year fixed mortgage rate of 6.36%, the year-over-year growth in the monthly cost to buy for a starter home was 38.1%, climbing to $2,657. This is more than 10 times the rate of increase for rent during the same period. In comparison, in December 2021, when the mortgage rate was half as high, the cost of buying in rent-favoring markets increased only at about half the rate of rent.

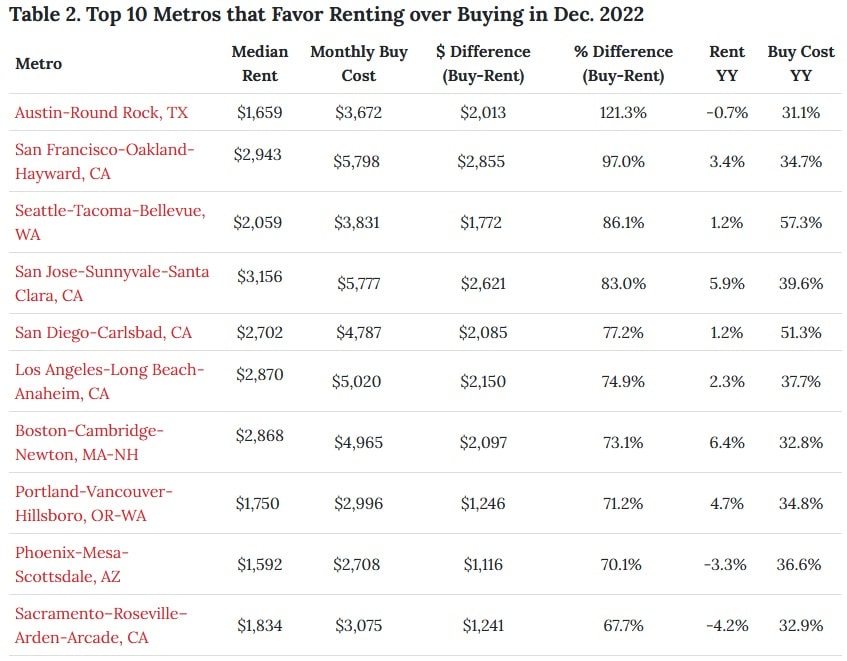
In the top 10 metros that favor renting over buying, the monthly payments for starter homes were 82.2% ($1,920) higher than rents. Similar to findings in June 2022, these rent-favoring metros are mostly markets with higher concentration of tech workers and high earners, where both the average rent-cost and buy-cost are higher than the national average. Austin, TX topped the list of markets that favor renting, where the monthly cost of buying a “starter” home was $3,672, which was 121.3% more than the monthly rent of $1,659, for a monthly savings of $2,013. San Francisco, CA; Seattle, WA; San Jose, CA and San Diego, CA metro areas round out the top five markets where the cost of buying was higher than the monthly rent.
Between December 2021 and June 2022, 11 metros that were previously more favorable for buying became more favorable for renting instead. In December 2022, 10 of these metros still had higher buy costs compared to the cost of renting, which highlights how the persistence of home price gains and mortgage rate increases have shifted the landscape in favor of renting in these areas. 1 In addition, it is interesting to see that even in metros like Miami, Tampa, and Orlando, which have seen some of the highest rent growth and rent costs in the past year, renting offers households a lower monthly cost for starter homes, even as it has become more expensive to do so, raising affordability concerns.
The benefit of buying is shrinking in buy-favoring markets
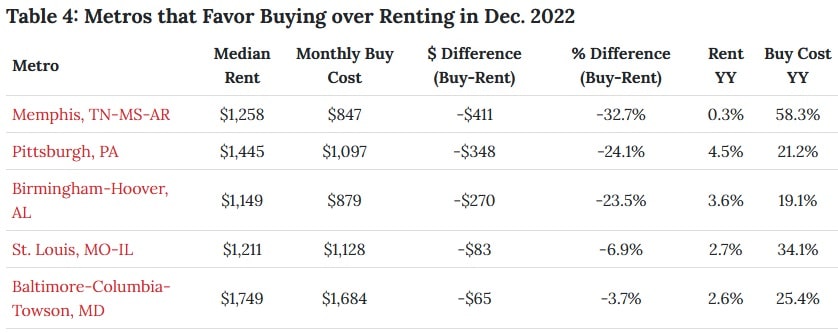
In December, there were only 5 metros that favored buying starter homes rather than renting. It is a significant decrease from the previous year, when there were 20 metros where buying was a more affordable option.
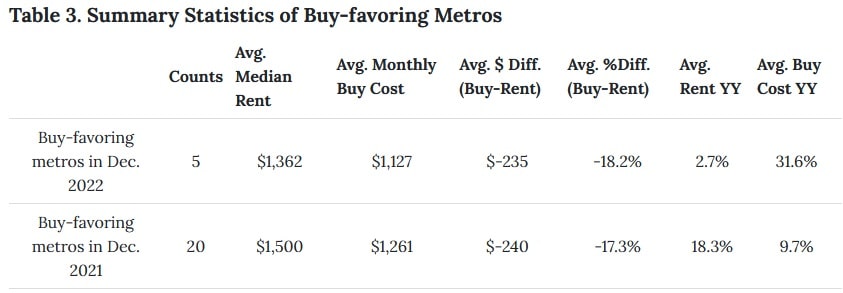
In these buy-favoring markets, the monthly cost of buying a starter home was $235 (18.2%) cheaper than the cost of renting, on average. In addition, none of these five metros has a higher monthly buy cost than the national average. However, the financial advantage of buying a starter home instead of renting has decreased in all of these markets. In particular, the savings from buying a starter home rather than renting in Memphis and Baltimore were nearly $300 less than a year ago. In St. Louis, the savings were $255 less than last December. In Pittsburgh and Birmingham, the savings were $130 and $101 less than the previous year respectively, as high prices and mortgage rates erode the financial payoff to buying, making renting a more attractive option.
These market average figures may not be an exact match for any particular household’s rent or home shopping tradeoffs. To help consumers navigate this decision, Realtor.com® provides a rent vs. buy calculator in which consumers can enter numbers specific to their situation to help them decide whether renting or buying is the better financial option. The calculator can help renters estimate the length of tenure needed for buying to make more financial sense than renting and allows renters to customize for location and tax specification.

2023 Rental Market Outlook
In 2022, the average year-over-year growth rate for 0-2 bedroom properties across the top 50 metros was 11.6%. While rent growth slowed throughout 2022, the more moderate slowdown seen in December could suggest that the current downward trend may not continue much longer. In fact, Realtor.com® forecasts the rent growth will continue in 2023, although at a slower pace.
On the demand side, as renting is a more cost-effective option than buying in most of the metros, would-be-homebuyers may spend longer in the rental market, sustaining rental housing demand at a relatively high level. Slowing new single-family construction and anticipated increases in the cost of buying a home in 2023 are likely to reinforce this trend, while expected economic strength increases the number of households searching for a place to call home. However, if the Fed fails to achieve its ‘soft landing’ goal, then a combination of high rent costs, high inflation, and low income growth may slow the formation of additional renter households. People may prefer to live with their families or take on roommates to save costs and adapt to economic uncertainty.
Specifically, we expect rental demand in big metros to be even stronger in 2023. Dense, urban markets like New York, Chicago, and Boston, which were among the slowest growth metros in 2021, are now topping the fastest growth list. In addition, the biggest rent growth in 2022 was seen among smaller studios, reversing the trend seen in 2021 of larger units commanding the biggest increases. The outperformance of studios is consistent with the recent trend of moving back to urban centers, where studios are more common.

In 2023, we expect a higher number of new rental homes to enter the market, increasing the supply available to renters. With high mortgage rates and high listing prices, homebuilding activity continues to pivot to multi-family properties. The latest available data shows that there are more multifamily than single-family homes under construction. Specifically, in November 2022, 915,000 units in buildings with five units or more were under construction compared to 777,000 single family units. In addition, the number of multifamily units under construction is 1.4 times higher than 3 years ago (pre-pandemic) and nearly 4 times higher than a decade ago. Thus, the completion of this extra supply could shift market balance, raising the still-low rental vacancy rate and helping ease recent rent growth driven by the strong demand.
Appendix: Rental Data – 50 Largest Metropolitan Areas – December 2022
| Metro | Overall Median Rent | Overall Rent YY | Studio Median Rent | Studio Rent YY | 1-br Median Rent | 1-br Rent YY | 2-br Median Rent | 2-br Rent YY |
| Atlanta-Sandy Springs-Roswell, GA | $1,669 | -1.7% | $1,631 | 0.8% | $1,567 | -1.75% | $1,786 | -2.1% |
| Austin-Round Rock, TX | $1,659 | -0.7% | $1,441 | 5.5% | $1,517 | -1.33% | $1,844 | 0.0% |
| Baltimore-Columbia-Towson, MD | $1,749 | 2.6% | $1,365 | 3.9% | $1,670 | 3.25% | $1,875 | 3.5% |
| Birmingham-Hoover, AL | $1,149 | 3.6% | $1,004 | -2.5% | $1,072 | 7.77% | $1,172 | 2.6% |
| Boston-Cambridge-Newton, MA-NH | $2,868 | 6.4% | $2,725 | 12.6% | $2,692 | 7.17% | $3,127 | 4.9% |
| Buffalo-Cheektowaga-Niagara Falls, NY | $1,188 | 2.3% | $821 | 5.5% | $1,165 | 7.26% | $1,251 | 5.4% |
| Charlotte-Concord-Gastonia, NC-SC | $1,592 | 2.3% | $1,469 | 3.9% | $1,516 | 4.47% | $1,727 | 0.6% |
| Chicago-Naperville-Elgin, IL-IN-WI | $1,968 | 17.5% | $1,683 | 38.0% | $1,922 | 14.96% | $2,177 | 18.0% |
| Cincinnati, OH-KY-IN | $1,265 | 7.0% | $1,195 | 8.7% | $1,194 | 5.34% | $1,367 | 3.0% |
| Cleveland-Elyria, OH | $1,152 | 5.0% | $896 | 5.8% | $1,082 | 1.01% | $1,257 | 8.1% |
| Columbus, OH | $1,237 | 5.4% | $958 | 5.0% | $1,167 | 5.93% | $1,312 | 3.2% |
| Dallas-Fort Worth-Arlington, TX | $1,564 | 3.4% | $1,333 | 3.6% | $1,422 | 3.00% | $1,791 | 2.0% |
| Denver-Aurora-Lakewood, CO | $1,902 | 0.8% | $1,567 | -0.8% | $1,776 | 0.22% | $2,172 | -0.2% |
| Detroit-Warren-Dearborn, MI | $1,227 | 5.8% | $1,141 | 12.8% | $1,098 | 6.64% | $1,336 | 3.3% |
| Hartford-West Hartford-East Hartford, CT | $1,730 | 7.5% | $1,455 | 8.2% | $1,551 | 5.44% | $1,900 | 6.2% |
| Houston-The Woodlands-Sugar Land, TX | $1,368 | 1.7% | $1,244 | 5.1% | $1,243 | 1.33% | $1,521 | 1.5% |
| Indianapolis-Carmel-Anderson, IN | $1,269 | 9.4% | $1,141 | 9.0% | $1,167 | 10.08% | $1,355 | 7.7% |
| Jacksonville, FL | $1,479 | 1.6% | $1,128 | 25.7% | $1,386 | 1.39% | $1,582 | -1.6% |
| Kansas City, MO-KS | $1,288 | 8.0% | $1,024 | 5.3% | $1,194 | 8.59% | $1,440 | 5.9% |
| Las Vegas-Henderson-Paradise, NV | $1,495 | -4.5% | $1,083 | -3.9% | $1,374 | -5.88% | $1,597 | -5.6% |
| Los Angeles-Long Beach-Anaheim, CA | $2,870 | 2.3% | $2,283 | 3.9% | $2,705 | 1.54% | $3,326 | 2.9% |
| Louisville/Jefferson County, KY-IN | $1,097 | 4.3% | $939 | 6.4% | $1,037 | 7.04% | $1,128 | 1.2% |
| Memphis, TN-MS-AR | $1,258 | 0.3% | $1,130 | -5.9% | $1,217 | -4.42% | $1,312 | -2.4% |
| Miami-Fort Lauderdale-West Palm Beach, FL | $2,682 | 4.7% | $2,480 | 8.6% | $2,393 | 3.65% | $2,884 | 1.6% |
| Milwaukee-Waukesha-West Allis, WI | $1,549 | 6.7% | $1,266 | 7.1% | $1,415 | 5.38% | $1,741 | 5.9% |
| Minneapolis-St. Paul-Bloomington, MN-WI | $1,527 | 2.5% | $1,245 | 1.7% | $1,442 | 1.19% | $1,793 | 1.6% |
| Nashville-Davidson–Murfreesboro–Franklin, TN | $1,602 | 2.5% | $1,510 | -5.4% | $1,516 | 3.70% | $1,707 | 1.3% |
| New Orleans-Metairie, LA | $1,417 | -0.7% | NA | NA | NA | NA | NA | NA |
| New York-Newark-Jersey City, NY-NJ-PA | $2,698 | 12.2% | $2,532 | 13.2% | $2,417 | 10.90% | $2,971 | 10.5% |
| Oklahoma City, OK | $950 | 9.6% | $834 | 14.1% | $871 | 5.82% | $1,057 | 11.8% |
| Orlando-Kissimmee-Sanford, FL | $1,812 | 4.0% | $1,559 | 6.3% | $1,632 | 2.78% | $2,006 | 1.3% |
| Philadelphia-Camden-Wilmington, PA-NJ-DE-MD | $1,697 | 0.4% | $1,430 | 1.7% | $1,623 | -1.15% | $1,811 | -2.9% |
| Phoenix-Mesa-Scottsdale, AZ | $1,592 | -3.3% | $1,293 | -3.7% | $1,476 | -2.41% | $1,731 | -4.7% |
| Pittsburgh, PA | $1,445 | 4.5% | $1,158 | 9.8% | $1,374 | -1.21% | $1,573 | 2.1% |
| Portland-Vancouver-Hillsboro, OR-WA | $1,750 | 4.7% | $1,393 | 0.9% | $1,652 | 3.57% | $1,950 | 7.1% |
| Providence-Warwick, RI-MA | $2,067 | 6.7% | NA | NA | NA | NA | NA | NA |
| Raleigh, NC | $1,537 | 2.3% | $1,423 | 7.3% | $1,431 | 3.74% | $1,627 | 0.0% |
| Richmond, VA | $1,368 | 6.2% | $1,182 | 5.7% | $1,260 | 8.38% | $1,530 | 5.4% |
| Riverside-San Bernardino-Ontario, CA | $2,037 | -6.0% | $1,405 | -13.7% | $1,793 | -6.18% | $2,133 | -7.1% |
| Rochester, NY | $1,335 | 4.5% | $985 | 7.5% | $1,254 | 5.42% | $1,464 | 3.5% |
| Sacramento–Roseville–Arden-Arcade, CA | $1,834 | -4.2% | $1,552 | -13.8% | $1,726 | -4.37% | $2,002 | -1.3% |
| San Antonio-New Braunfels, TX | $1,294 | 3.6% | $1,143 | -1.2% | $1,178 | 1.68% | $1,428 | 0.8% |
| San Diego-Carlsbad, CA | $2,702 | 1.2% | $2,206 | 2.8% | $2,479 | 1.25% | $2,975 | 2.0% |
| San Francisco-Oakland-Hayward, CA | $2,943 | 3.4% | $2,389 | 3.3% | $2,674 | -0.04% | $3,339 | 2.2% |
| San Jose-Sunnyvale-Santa Clara, CA | $3,156 | 5.9% | $2,438 | 3.9% | $2,819 | 3.25% | $3,602 | 9.3% |
| Seattle-Tacoma-Bellevue, WA | $2,059 | 1.2% | $1,744 | 0.7% | $2,009 | 0.29% | $2,408 | 1.8% |
| St. Louis, MO-IL | $1,211 | 2.7% | $954 | 3.8% | $1,143 | 2.23% | $1,272 | -1.7% |
| Tampa-St. Petersburg-Clearwater, FL | $1,760 | -4.3% | $1,621 | 1.0% | $1,608 | -3.86% | $1,895 | -6.8% |
| Virginia Beach-Norfolk-Newport News, VA-NC | $1,432 | 2.4% | $1,407 | 9.0% | $1,378 | 1.82% | $1,449 | 1.0% |
| Washington-Arlington-Alexandria, DC-VA-MD-WV | $2,103 | 3.7% | $1,748 | 3.1% | $1,999 | 2.70% | $2,419 | 4.1% |
Methodology
Rental data as of December for units advertised as for-rent on Realtor.com®. Rental units include apartment communities as well as private rentals (condos, townhomes, single-family homes). All units were studio, 1-bedroom, or 2-bedroom units. We use communities that reliably report data each month within the top 50 largest metropolitan areas. National rents were calculated by averaging the medians of the 50 largest metropolitan areas. Realtor.com® began publishing regular monthly rental trends reports in October 2020 with data history stretching back to March 2019.
The monthly cost of buying a home was calculated by averaging the median listing prices of studio, 1-bed, and 2-bed homes, weighted by the number of listings, in each housing market. Monthly buying costs assume a 7% down payment, with a mortgage rate of 6.36%, and include taxes, insurance and HOA fees.
With the release of its August 2022 rent report, Realtor.com® incorporated a new and improved methodology for capturing and reporting more comprehensive rental listing trends and metrics. The new methodology is expected to yield a cleaner, more representative and more consistent measurement of rental listings and trends at both the national and local level. The methodology has been adjusted to better represent the true cost of primary housing for renters. Most areas across the country will see minor changes with a smaller handful of areas seeing larger updates. As a result of these changes, the rental data released since September 2022 will not be directly comparable with previous releases (files downloaded before September 2022) and Realtor.com® economics blog posts. However, future data releases, including historical data, will consistently apply the new methodology.
Source: www.realtor.com
Authors: Danielle Hale & Jiayi Xu
M&M NEWS
Related Articles
The Real Estate Market is Cyclical, Don’t Panic, Adjust!
The Real Estate Market is Cyclical, Don’t Panic, Adjust! The Real Estate market is cyclical. The data shows, and it’s clear that we are experiencing one of the toughest real estate markets in the past decade. As bad as it is, there are certain agents who do well,...
Why the housing market is going from tough to terrible
Why the housing market is going from tough to terrible Do you like this Article ? Sign up HERE for your FREE M&M Account to receive more Real Estate related information and news and THIS article. M&M Membership includes: FREE Coaching Events & Workshops,...
As mortgage rates hit 8%, home ‘affordability is incredibly difficult,’ economist says
As mortgage rates hit 8%, home ‘affordability is incredibly difficult,’ economist says Do you like this Article ? Sign up HERE for your FREE M&M Account to receive more Real Estate related information and news and THIS article. M&M Membership includes: FREE...